
COVID Task Force 4: Building A Crystal Ball for the Airlines
It’s been a while since we had an update on what the COVID-19 Task Force (CTF) is doing. At the time of this blog’s publishing, we have a total of 22 global enterprises participating, including some of the largest airlines in the world.
This is truly unprecedented! Because airline businesses are so competitive and their margin so thin, airlines have never willingly shared data historically. But in times of crisis, we unite! And we are proud to see that our global partners can look beyond themselves for the greater good of the entire industry. And we are so proud to be a part of this historical moment.
We have done a lot since our last update, so let’s quickly summarize our progress.
Designing Predictive Features and Training Predictive Models
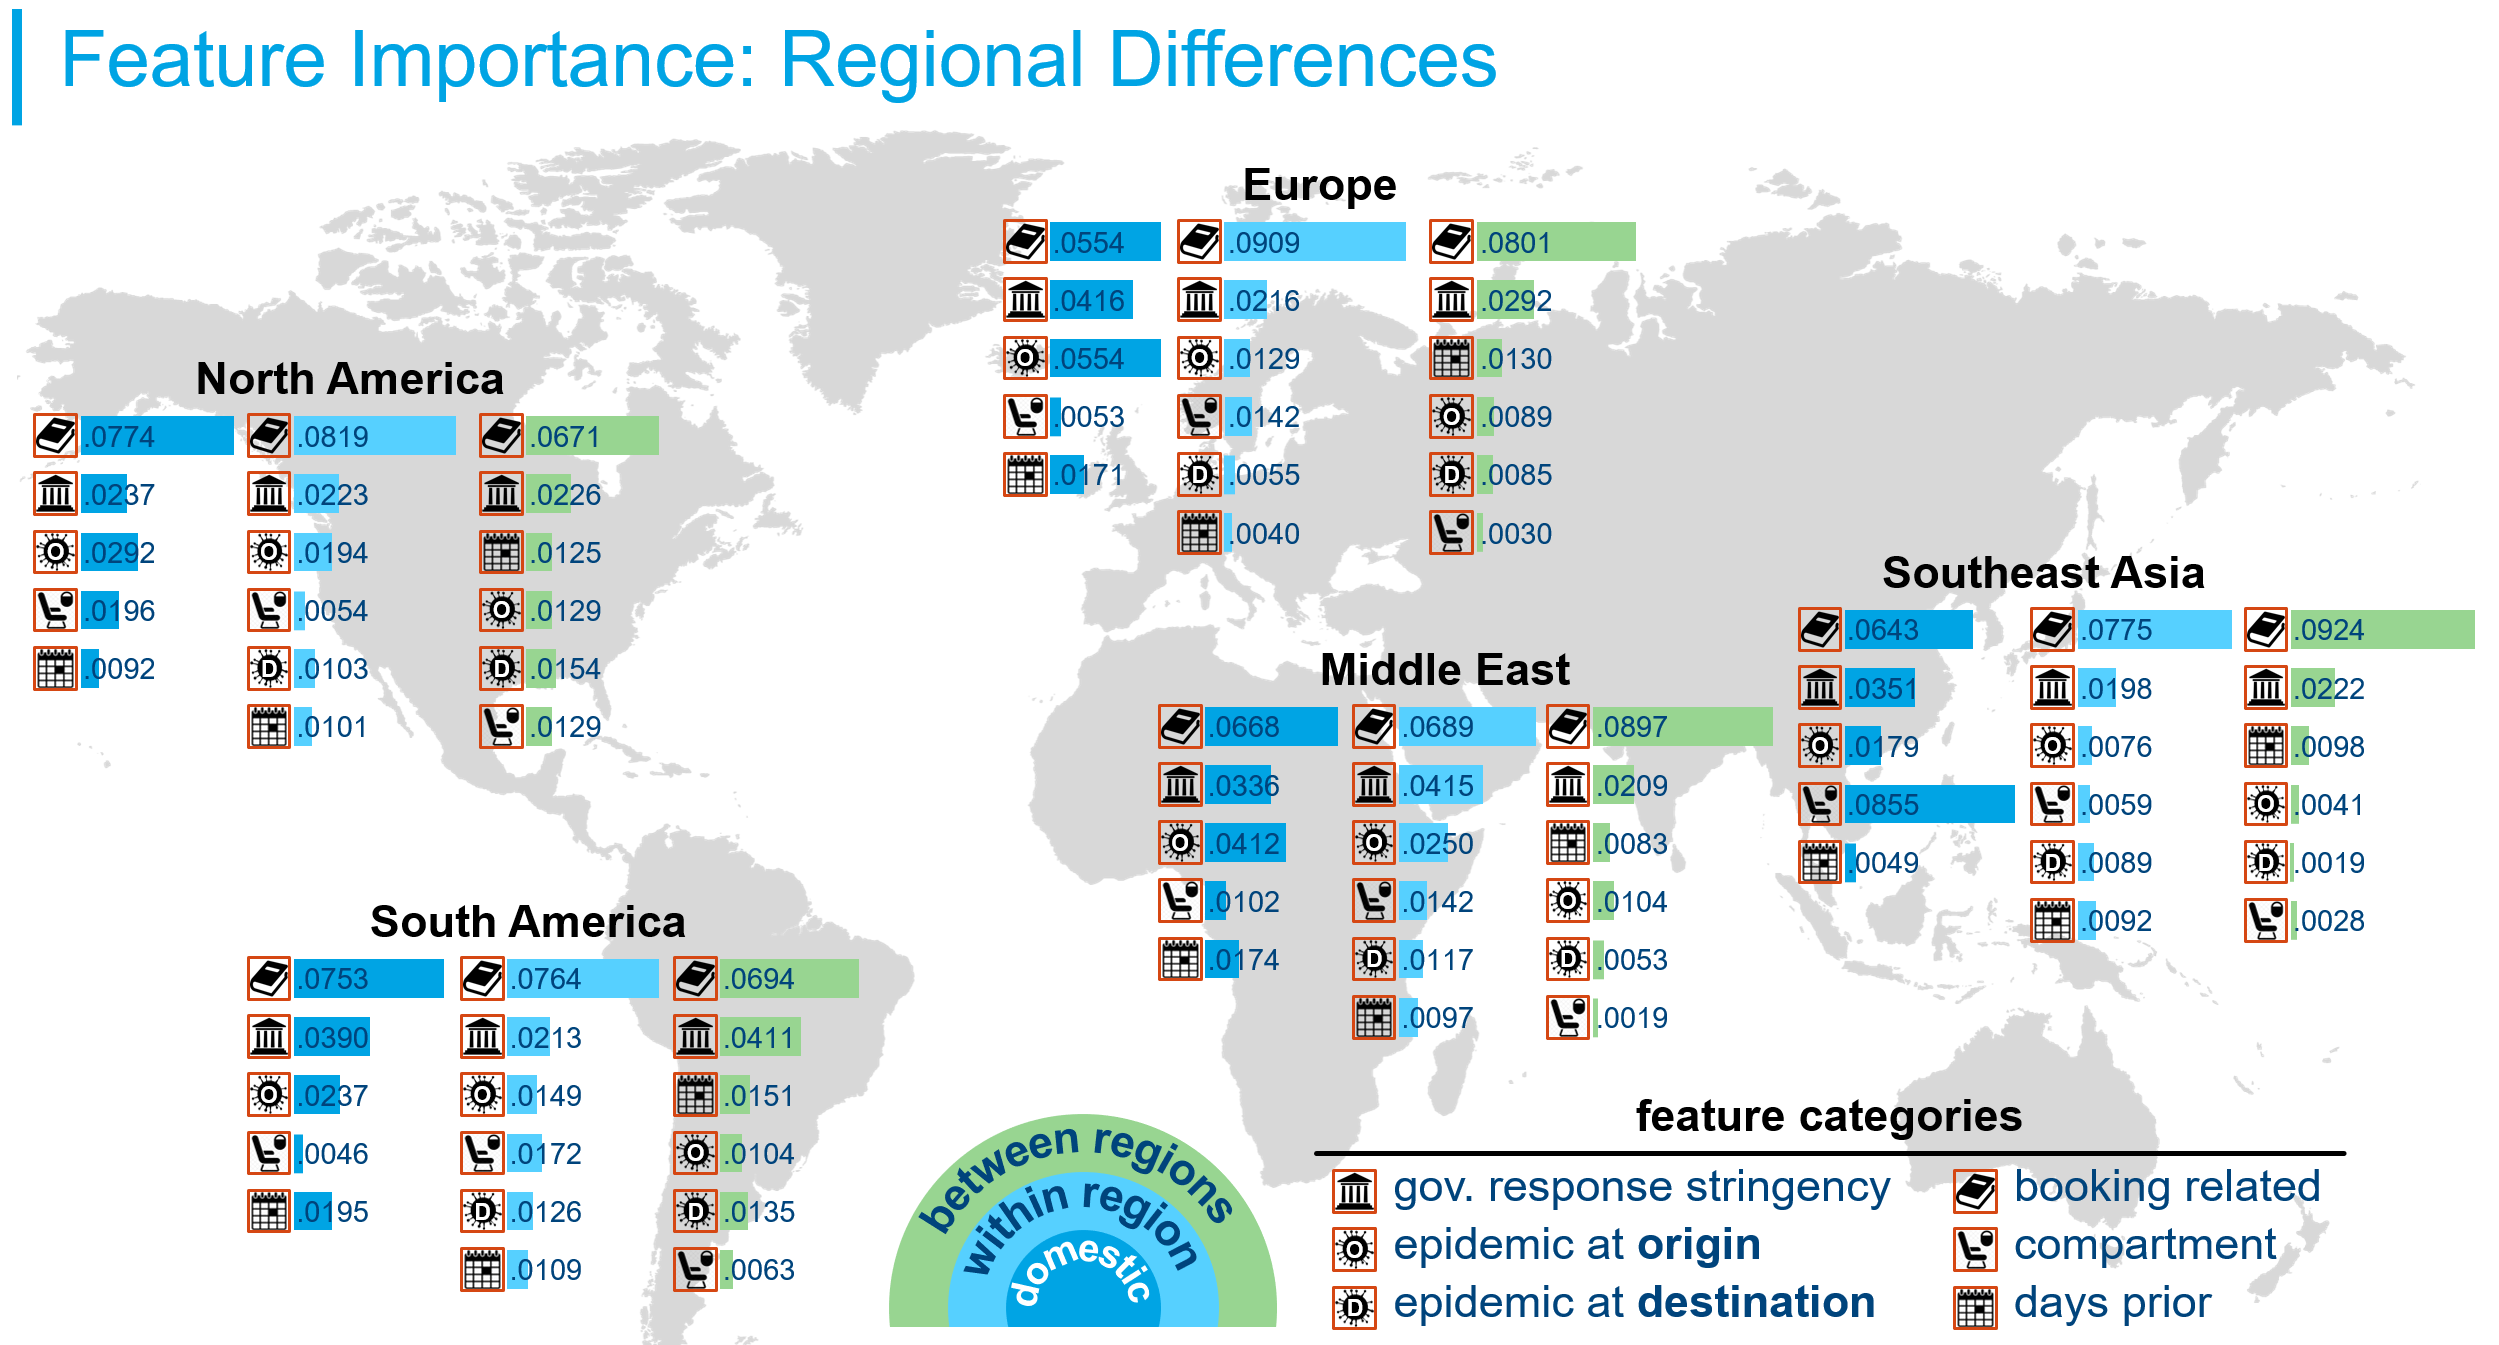
If you remember from the previous updates, one of our goals is to model the chain of causality between the epidemic and consumer demand (e.g. bookings, or other demand signals). Leveraging third-party data sources (e.g. epidemic data from Johns Hopkins, and government response data from Oxford Univ.), we have derived several predictive features from this data. These include simple normalization of the epidemic rate by the population density to the restrictiveness of government policies along a specific flight route. The figure below illustrates the relative importance of the different feature categories we’ve used to predict airline bookings in different regions.
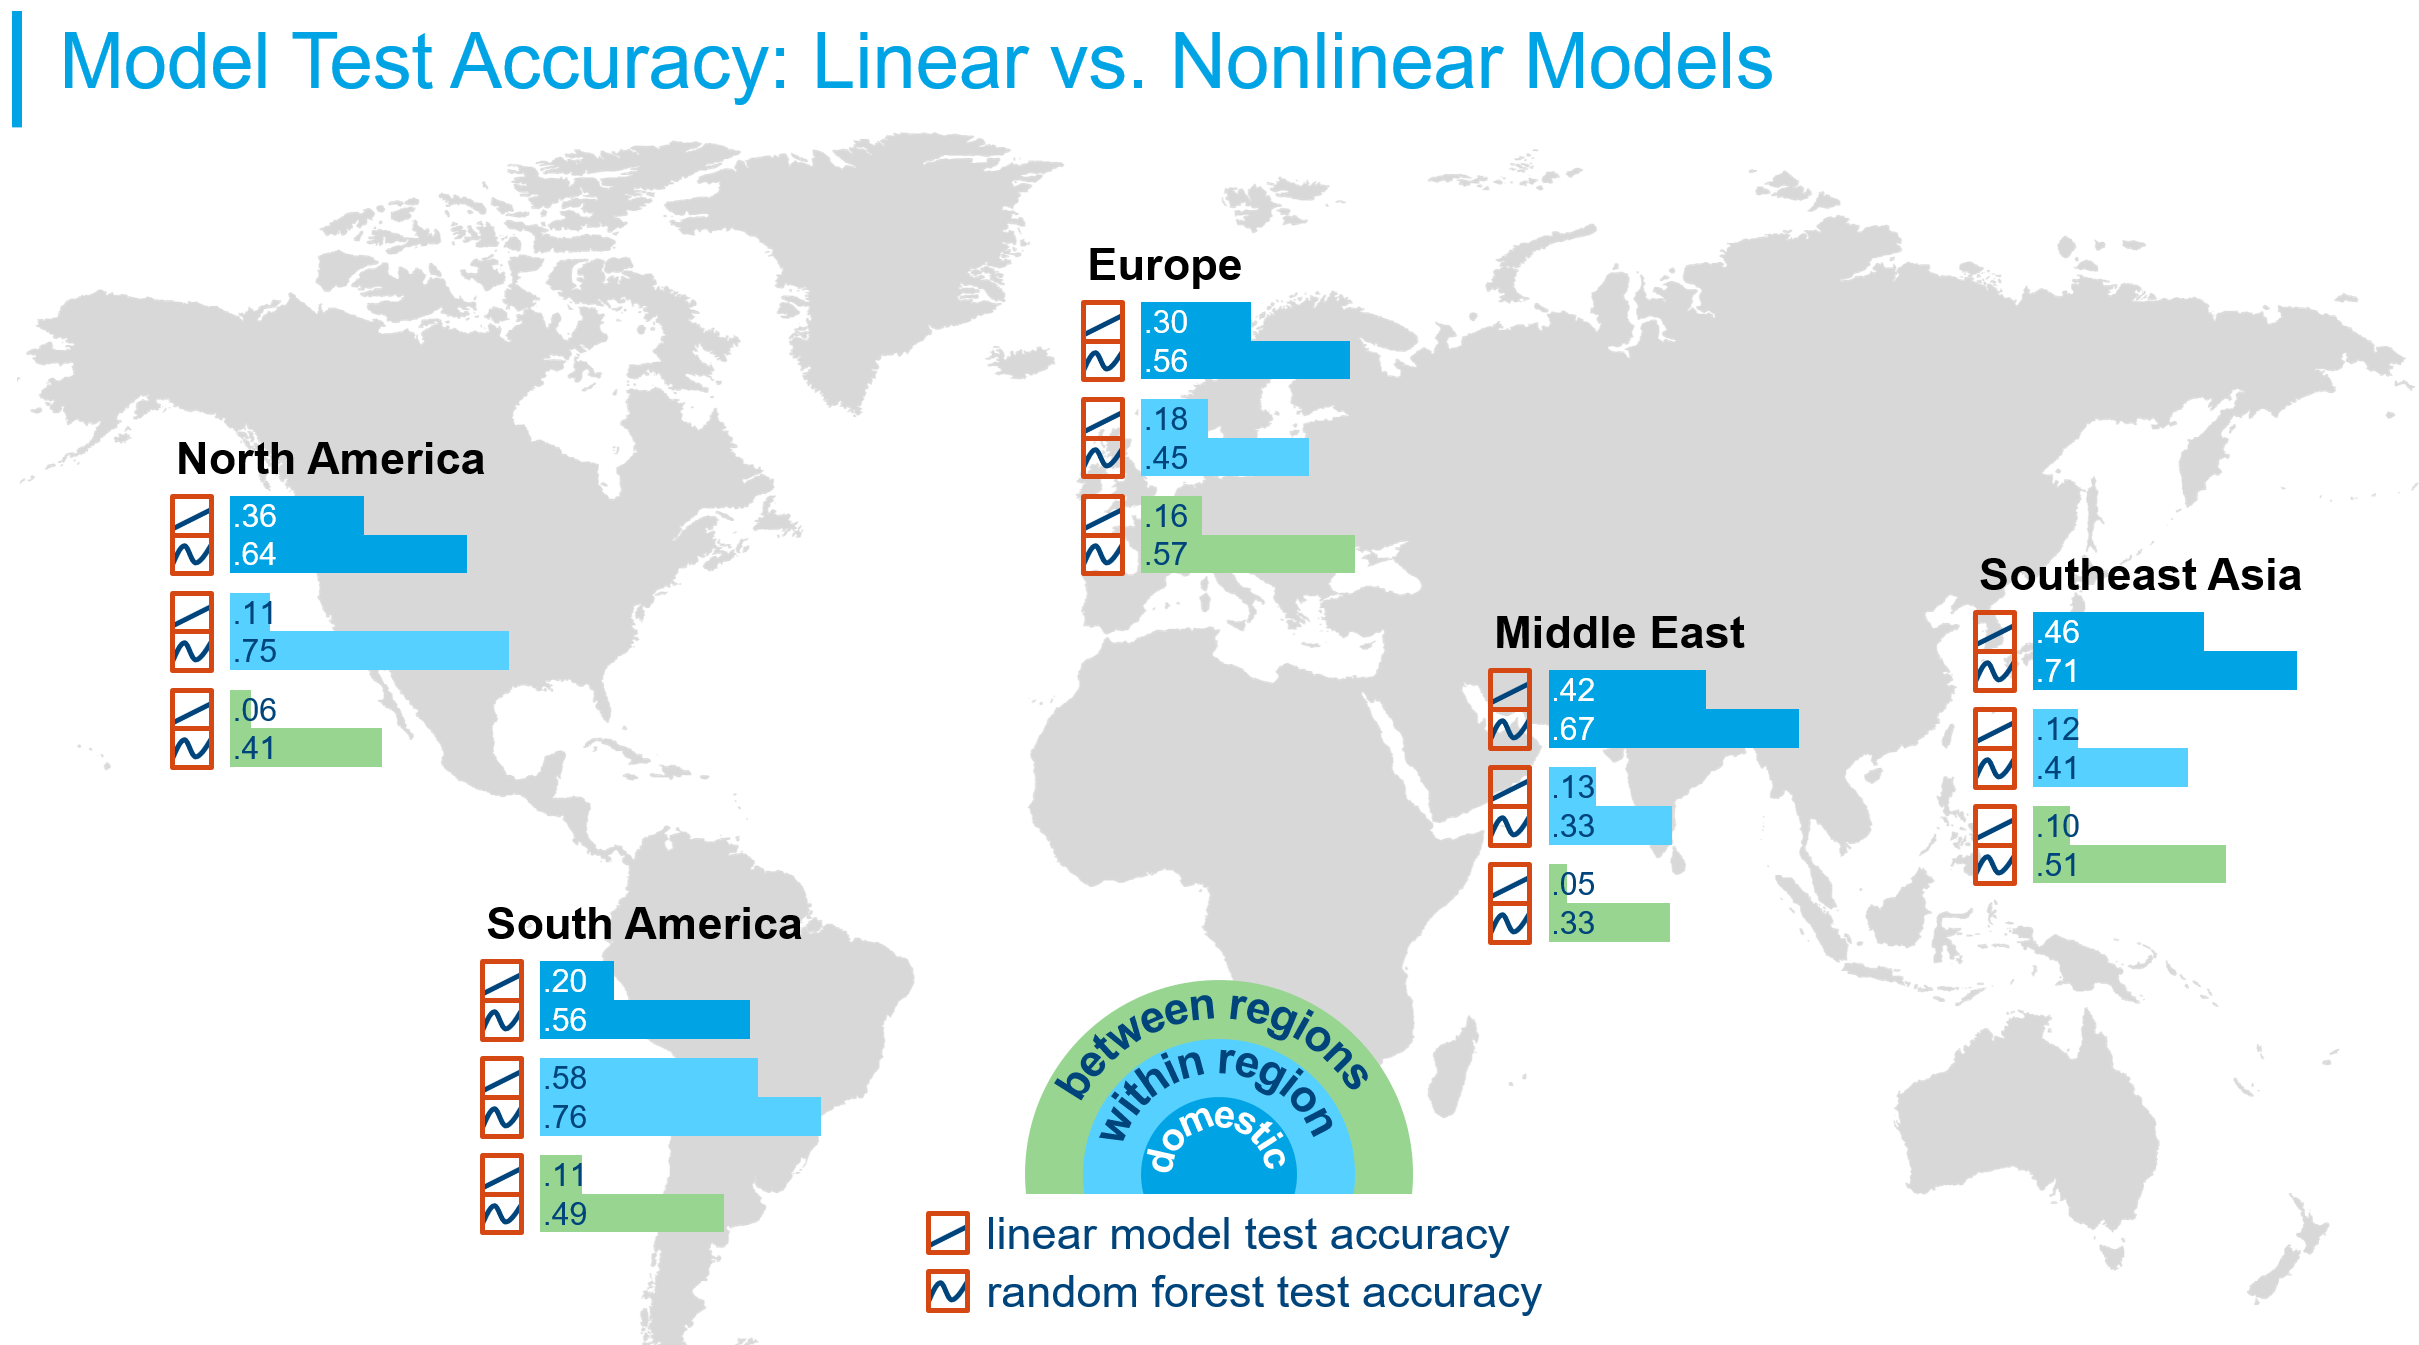
Using these features, we have trained several different kinds of models—from the highly interpretable linear models with limited predictive power, to a random forest model that’s hard to interpret, but predicts much better (shown in the figure below). These models were tested on a held-out dataset, and their prediction accuracy is measured using Pearson’s correlation coefficient. Due to the significant difference in predictive performance, we will be using the random forest as our model of choice in future investigations.
If you want to dive deeper into the modeling details, our Task Force team members have presented this work several times through different venues. Feel free to check out the video recording of the following events. But rest assured that no carrier specific results were revealed.
- CTF Webinars should have the most detail (however, these are accessible for CTF participants only). You should’ve joined!
- Virtual Outperform 2020
- AGIFORS Symposium 2020
- Ken Kennedy Institute Data Science Conference at Rice Univ.
What Can We Do with a Predictive Model?
Now we have a model that can predict booking, so what? Keep in mind that this model will provide you with a predicted level of booking based on the input data (i.e. epidemic and government response). So there are really only 2 things we can do:
- Wait
- Simulate scenarios
The first approach is that we can simply wait until the epidemic slows down and the governments’ travel restrictions are relaxed, then we can feed our model with real data from that future time. No doubt our model would produce a realistic booking forecast based on the real input of the future. However, this often doesn’t provide businesses with enough lead time to plan, prepare, and respond. Because when bookings are recovering and changing, businesses usually need to deal with many moving parts to optimize their operation.
The alternative approach is that we can run some scenario simulations. We can make an educated guess about what the epidemic condition and government response might be some time in the future. Then we feed this potential scenario to our model and let it make a booking forecast based on the hypothetical scenario.
This approach is beneficial for 2 reasons. The first benefit is that we can simulate multiple scenarios and observe potential recovery trajectories. This will allow us to get a sense of what we could expect under all the different simulated scenarios, and this would allow us to prepare for the likely scenarios. Second, we can do this before the demand is actually returning while most of the business operation is still fairly static.
Due to these practical benefits for an airline, we will be focusing on the second approach. Now, the challenge becomes how can we come up with a good guess about the future condition of the epidemic and government response.
Coming Up with Good Scenarios
So how can we generate good scenarios (i.e. those that represent plausible futures, and not just any possible future)? Remember, our random forest model requires 2 sets of inputs (i.e. epidemic data and government response data). Therefore, we need a good estimate of the future epidemic condition and future government response stringency. To do this, we look to another data source for help.
The Institute for Health Metrics and Evaluation (IHME) at UW Medicine publishes future projections of the COVID-19 pandemic at a global scale with a high degree of granularity. IHME provides the future projection of COVID-19 cases, deaths, and many other COVID-19 related metrics (e.g. testing, hospital resources, mask usage, etc) at the country level. These are precisely the epidemic inputs we need for our random forest booking-prediction model.
What about the government response? Although it’s very hard to accurately predict how different governments would respond to future epidemic conditions, we can leverage a proxy. Since the most important government responses to COVID-19 involve restricting its citizen’s mobility to curtail COVID-19 spread, a country’s mobility data should be highly correlated to its government’s response stringency.
Evidently, IHME also tracks people’s mobility based on anonymized cell phone movement data as a measure of a country’s social distancing effectiveness. A time series projection of this mobility would serve as a good proxy for the government response stringency, which is the second set of inputs to our booking-forecast model.
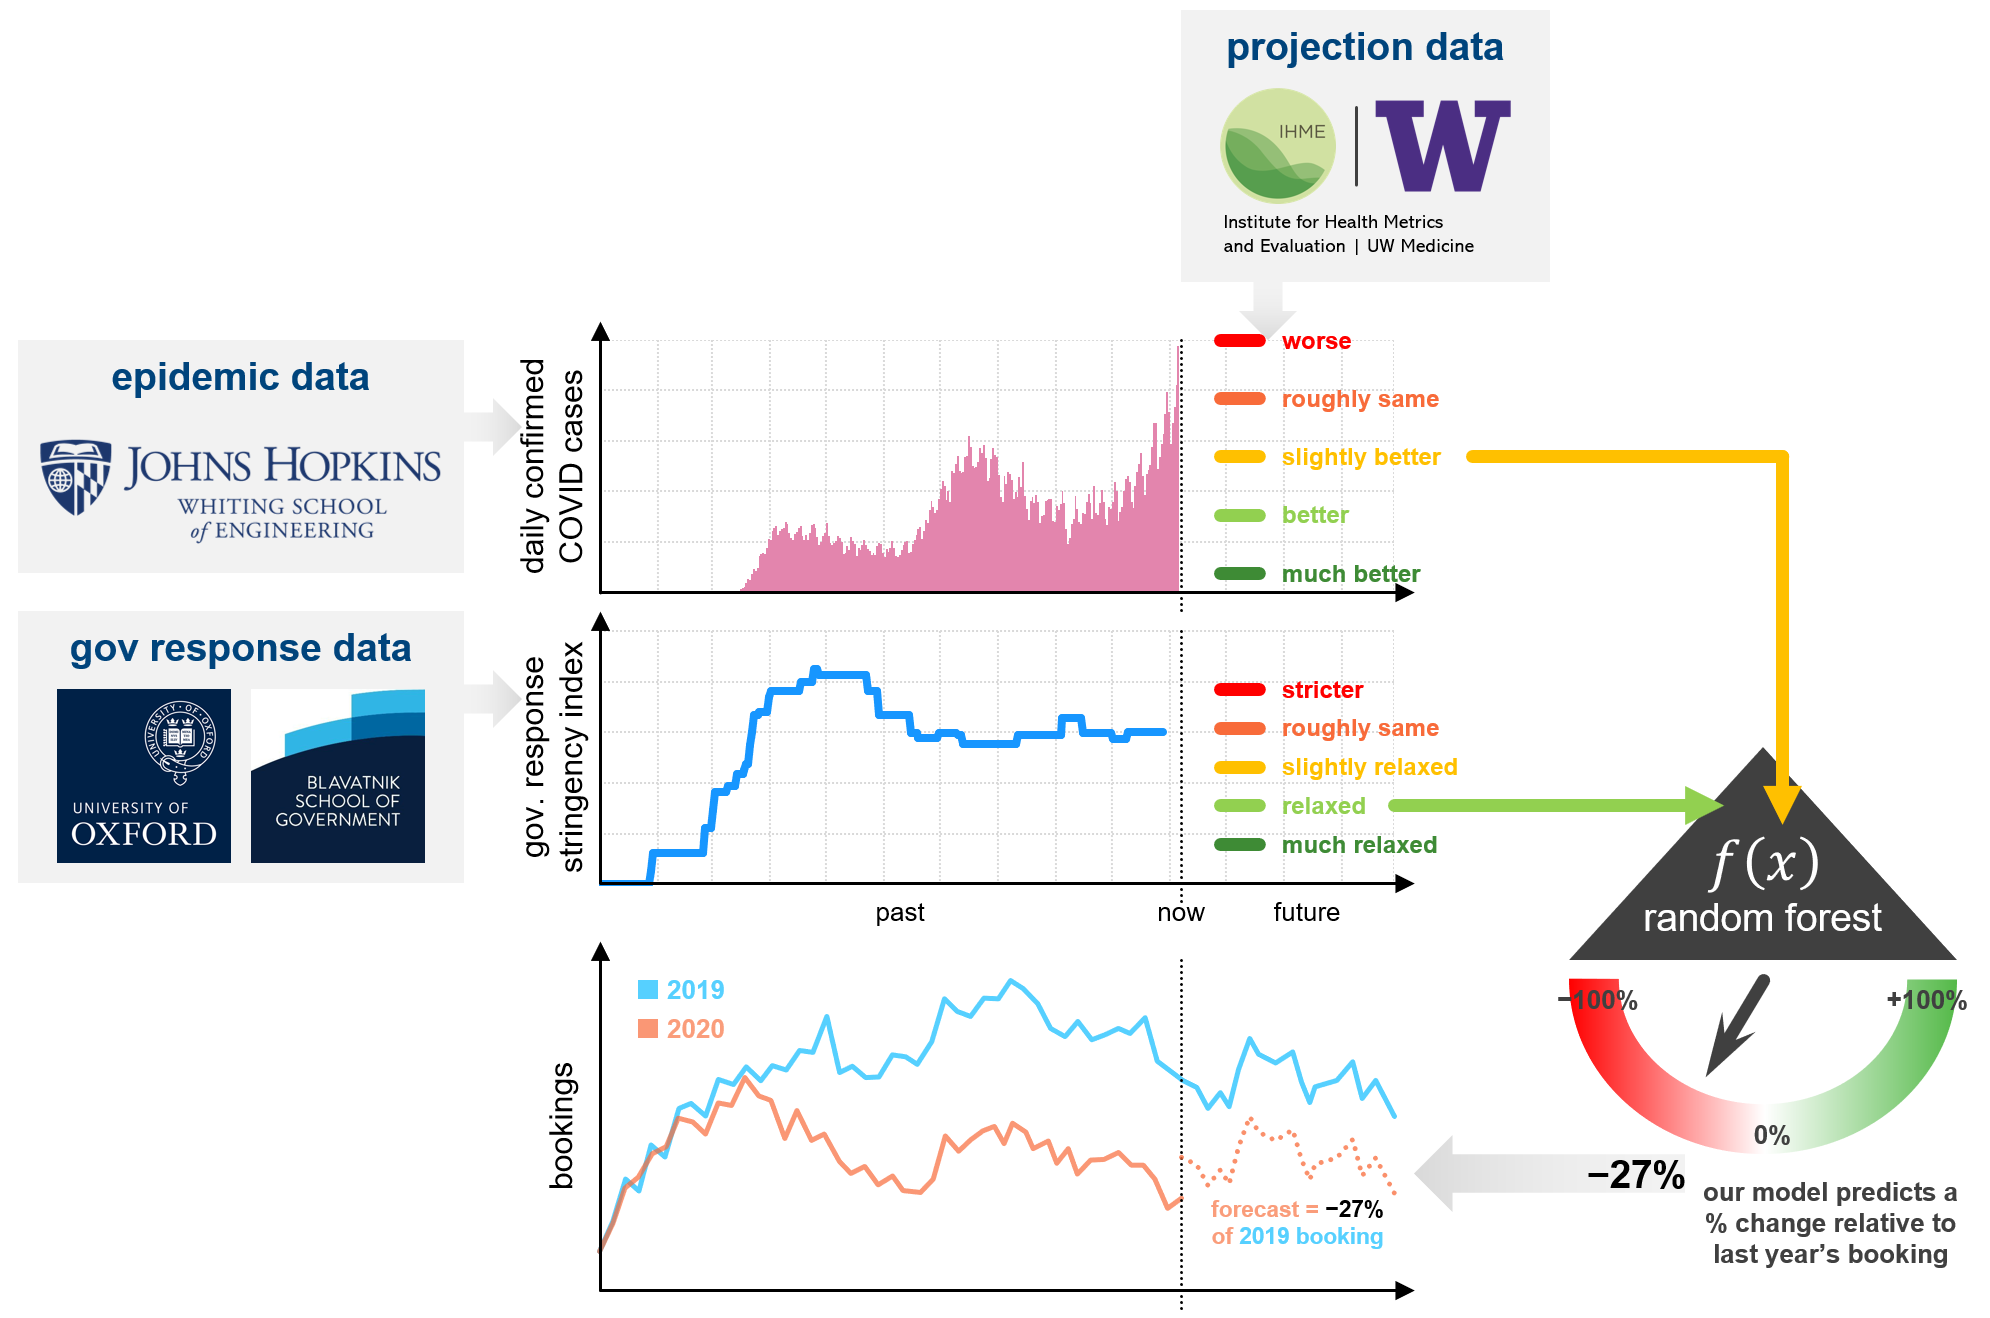
Now we have an educated guess of the future epidemic trajectory and a good proxy for the future government response stringency. This means we now have all the ingredients we need to make a reasonable prediction of how booking would return in the future. The following flow chart illustrates our forecasting pipeline. We are now using this pipeline to forecast booking recovery for our CTF participants. And next time we should be able to share some aggregated regional level results.
Conclusion
Together with the participants in our CTF, we’ve built a crystal ball for the airline industry by leveraging multiple 3rd-party data sources. This crystal ball (i.e. our random forest booking-forecast model) is unique in several ways.
- It’s built by experts in the airline industry.
- It’s trained with real booking data aggregated from more than a dozen of some of the largest airlines in the world. This is truly unique and unprecedented.
- It’s validated for its ability to predict by testing on a held-out data set.
- It’s a data-dependent model. We must provide 2 sets of inputs (i.e. epidemic conditions and government response stringency) that represent realistic or reasonably good guesses about the future state, so we are not just making a forecast out of thin air.
Now that we have a unique crystal ball, let’s see what it will tell us next time. So stay tuned for the next CTF update, because the future will be revealed. Remember, it’s not too late to join us. Please consult your CSM about your eligibility.
If you missed any of the previous updates, they are all accessible here: