
COVID Task Force 5: How Airlines Will Return to Cruising Altitude

Last time, we’ve described the process of how we design and build our booking-prediction model, and how to use it to predict future bookings. Today, we will examine some real predictions from this model. The results in the blog post were first published in Business Travel News, but we will discuss the results in greater detail here.
We used a highly flexible machine learning model (i.e. random forest) that, in theory, can fit any nonlinear data. Moreover, we’ve trained and tested our model with an incredible dataset aggregated from the top markets of ~20 of the biggest airlines in the world. This dataset is huge, consists of an aggregate of ~625 million bookings globally across all our airline participants. It is also dynamic, growing at about ~13.9 million bookings every week, and it will only get bigger faster as more of our airline customers choose to participate in our Task Force. This is not only unique, it’s unprecedented.
The Uniqueness of Our Crystal Ball
We have used several 3rd-party data sources (i.e. epidemic data from Johns Hopkins, and government response data from Oxford Univ.) to build our model. So, in order to make a good prediction on how future bookings will return, we must provide our model with a realistic or a good guess of the future epidemic condition as well as the future government response stringency. Although this requirement will limit the applicability of our model (if you don’t have the input, you can’t use it), it’s actually a strength. The extra required inputs allow our model to more accurately reflect reality. This makes our prediction more contextual and more specific.
However, it seems that we are simply turning one hard problem (i.e. forecasting bookings) into another equally hard problem (i.e. forecasting the epidemic and government response). Fortunately, we are able to leverage another data source (i.e. IHME from Univ of Washington’s Medical School) to help us forecast the coronavirus epidemic. Moreover, IHME also provides mobility data at the country level based on cell-phone movement data, which is a very good proxy for a government’s response stringency.
So even though we are indeed turning one hard problem into another hard problem, we are allocating the best experts to deal with the problem they are best at solving. We are letting the medical experts and the epidemiologists solve the problem that they are most equipped to solve (i.e. forecasting the epidemic and government response). And we are letting PROS scientists solve the problem that we are best at solving (i.e. forecasting bookings). So our model is the culmination of a global collaboration among airlines, between industry and academia, and also across many different domains of expertise.
This convergence of diversity is what makes our model unique and probably better than any others out there.
A Plausible Booking Recovery Patterns of Passenger Mix
So what can we predict using the IHME’s data as inputs to our random forest booking-prediction model? Based on the projected epidemic and mobility data 3—6 months out, we can make 3 concrete sets of predictions compared to the current recovery status as of Nov 7th, 2020.
In the following discussions, all data and predictions are normalized to 2019 level to obfuscate the market shares of our airline participants. The current status and predicted recovery are estimated over a period of 6 weeks.
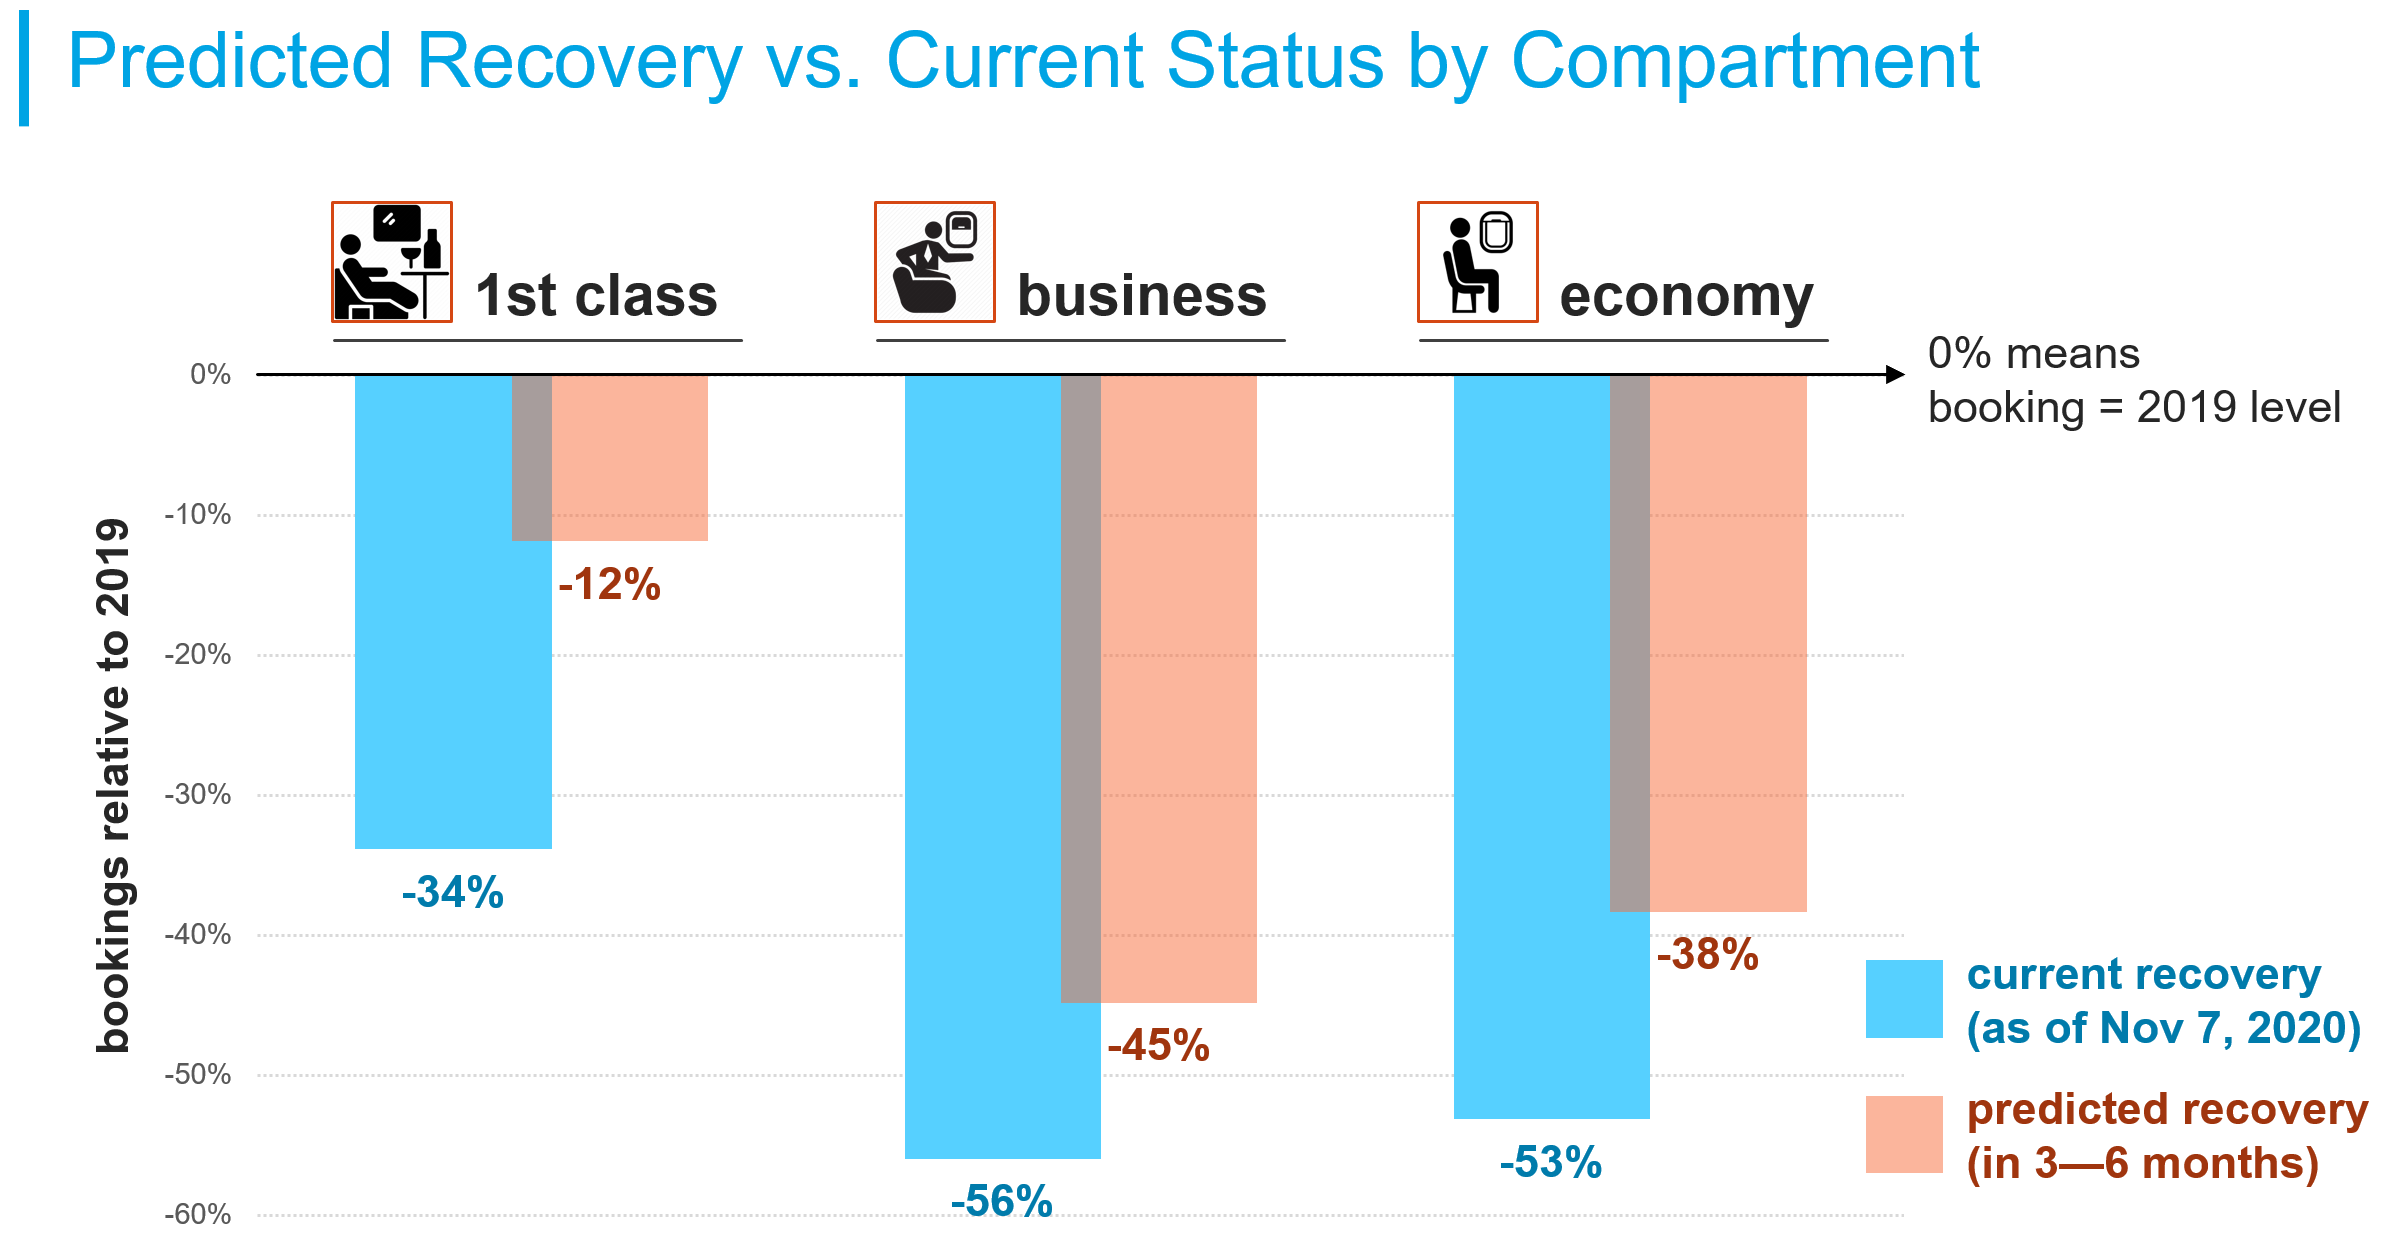
The simplest of all is the passenger mix of the returned bookings (see figure above). In 3—6 months, we will see a significant recovery (~22%) of 1st class passengers. However, business and economy class passengers would’ve only recovered about half that amount. Since we are already seeing the most recovery in 1st class flyers currently, the recovery rate for business and economy flyers will lag further behind relative to the 1st class flyers in 3—6 months.
Predicted Booking Recovery for Where You Are and Where You Are Going
The next set of predictions are for different types of flights across the 5 regions we’ve defined (i.e. North America, South America, Europe, Middle East, and Southeast Asia). And we have analyzed 3 types of flights:
- domestic flights
- international flights within a region (intraregional)
- international flights between regions (interregional)
There are a lot of data in the figure below, but a few interesting patterns deserve attention. First, domestic flights have been recovering the most, followed by interregional flights, and finally, intraregional flights are seeing the least recovery currently. This pattern is persistent in our predicted recovery 3—6 months out from Nov 7.
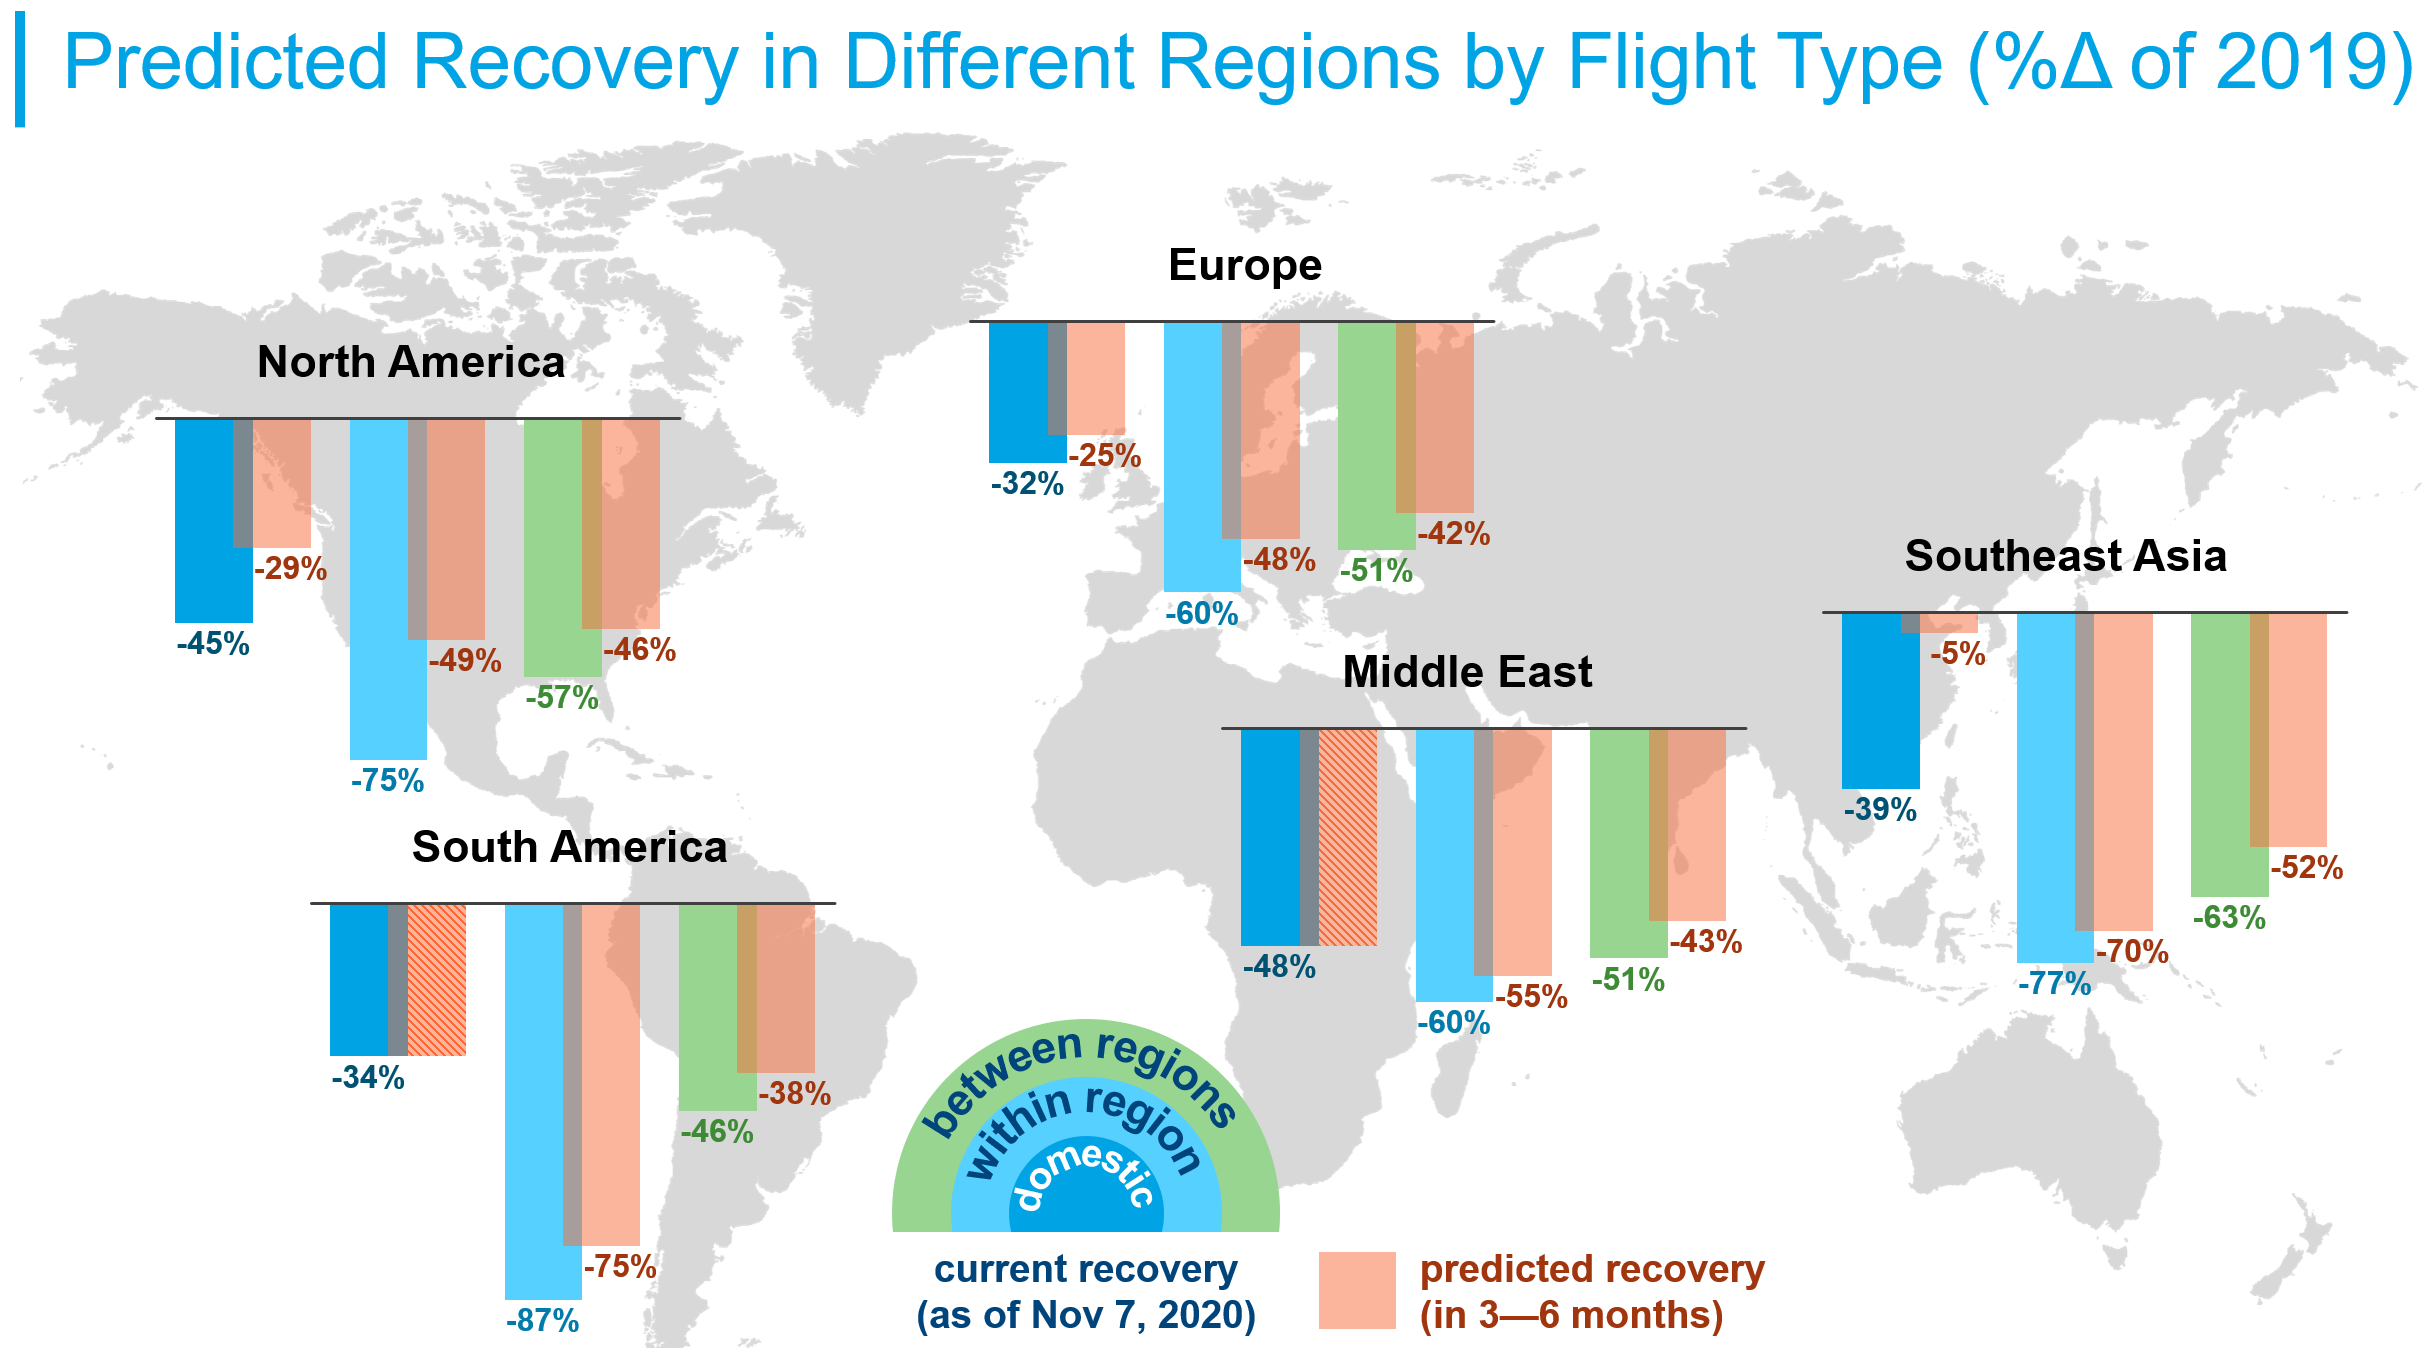
In 3—6 months, we can expect to see a fairly consistent (~10%) recovery for interregional flights across all regions. However, the predicted recovery pattern for intraregional flights is more variable, ranging from ~5% in the Middle East to ~25% in North America. And this variability is even more pronounced for domestic flights, ranging from ~5% for Europe to ~35% in Southeast Asia. At this rate, our model is essentially predicting a near full recovery for Southeast Asia domestic flights to a level that is only 5% below the 2019 level. One major factor at play is the cultural advantage in Southeast Asian countries (e.g. mask wearing) that allows them to more effectively curb the spread of COVID-19.
Note that we did not provide a prediction for domestic flights in South America or the Middle East. This is because our data do not have a sufficiently diverse pool of carriers that offer domestic flights in these regions to give a generalizable prediction for all the countries within these regions.
In 3—6 Months, Bookings 6+ Months Out Will Fully Recover
The last set of predictions is the most interesting as it’s related to people’s propensity to travel in the future. And we have a positive prediction!
Since people can book flights up to 1 year before their departure date, and there tend to be much fewer bookings for a further-out travel date, it’s a common practice to bucket the number of booking in days-prior to the travel date into timeframes of different length. These timeframes are represented as different bin sizes (i.e. 1 week, 1 week, 2 weeks, 2 weeks, 3 weeks, 6 weeks, 11 weeks, 6 months) in the figure below.
As of Nov 7th, we are currently seeing a roughly ~50%—75% drop in booking relative to 2019 in all bookings up to 6-months before the travel date. But we are only seeing a modest drop of 15% for travels that are more than 6 months out.
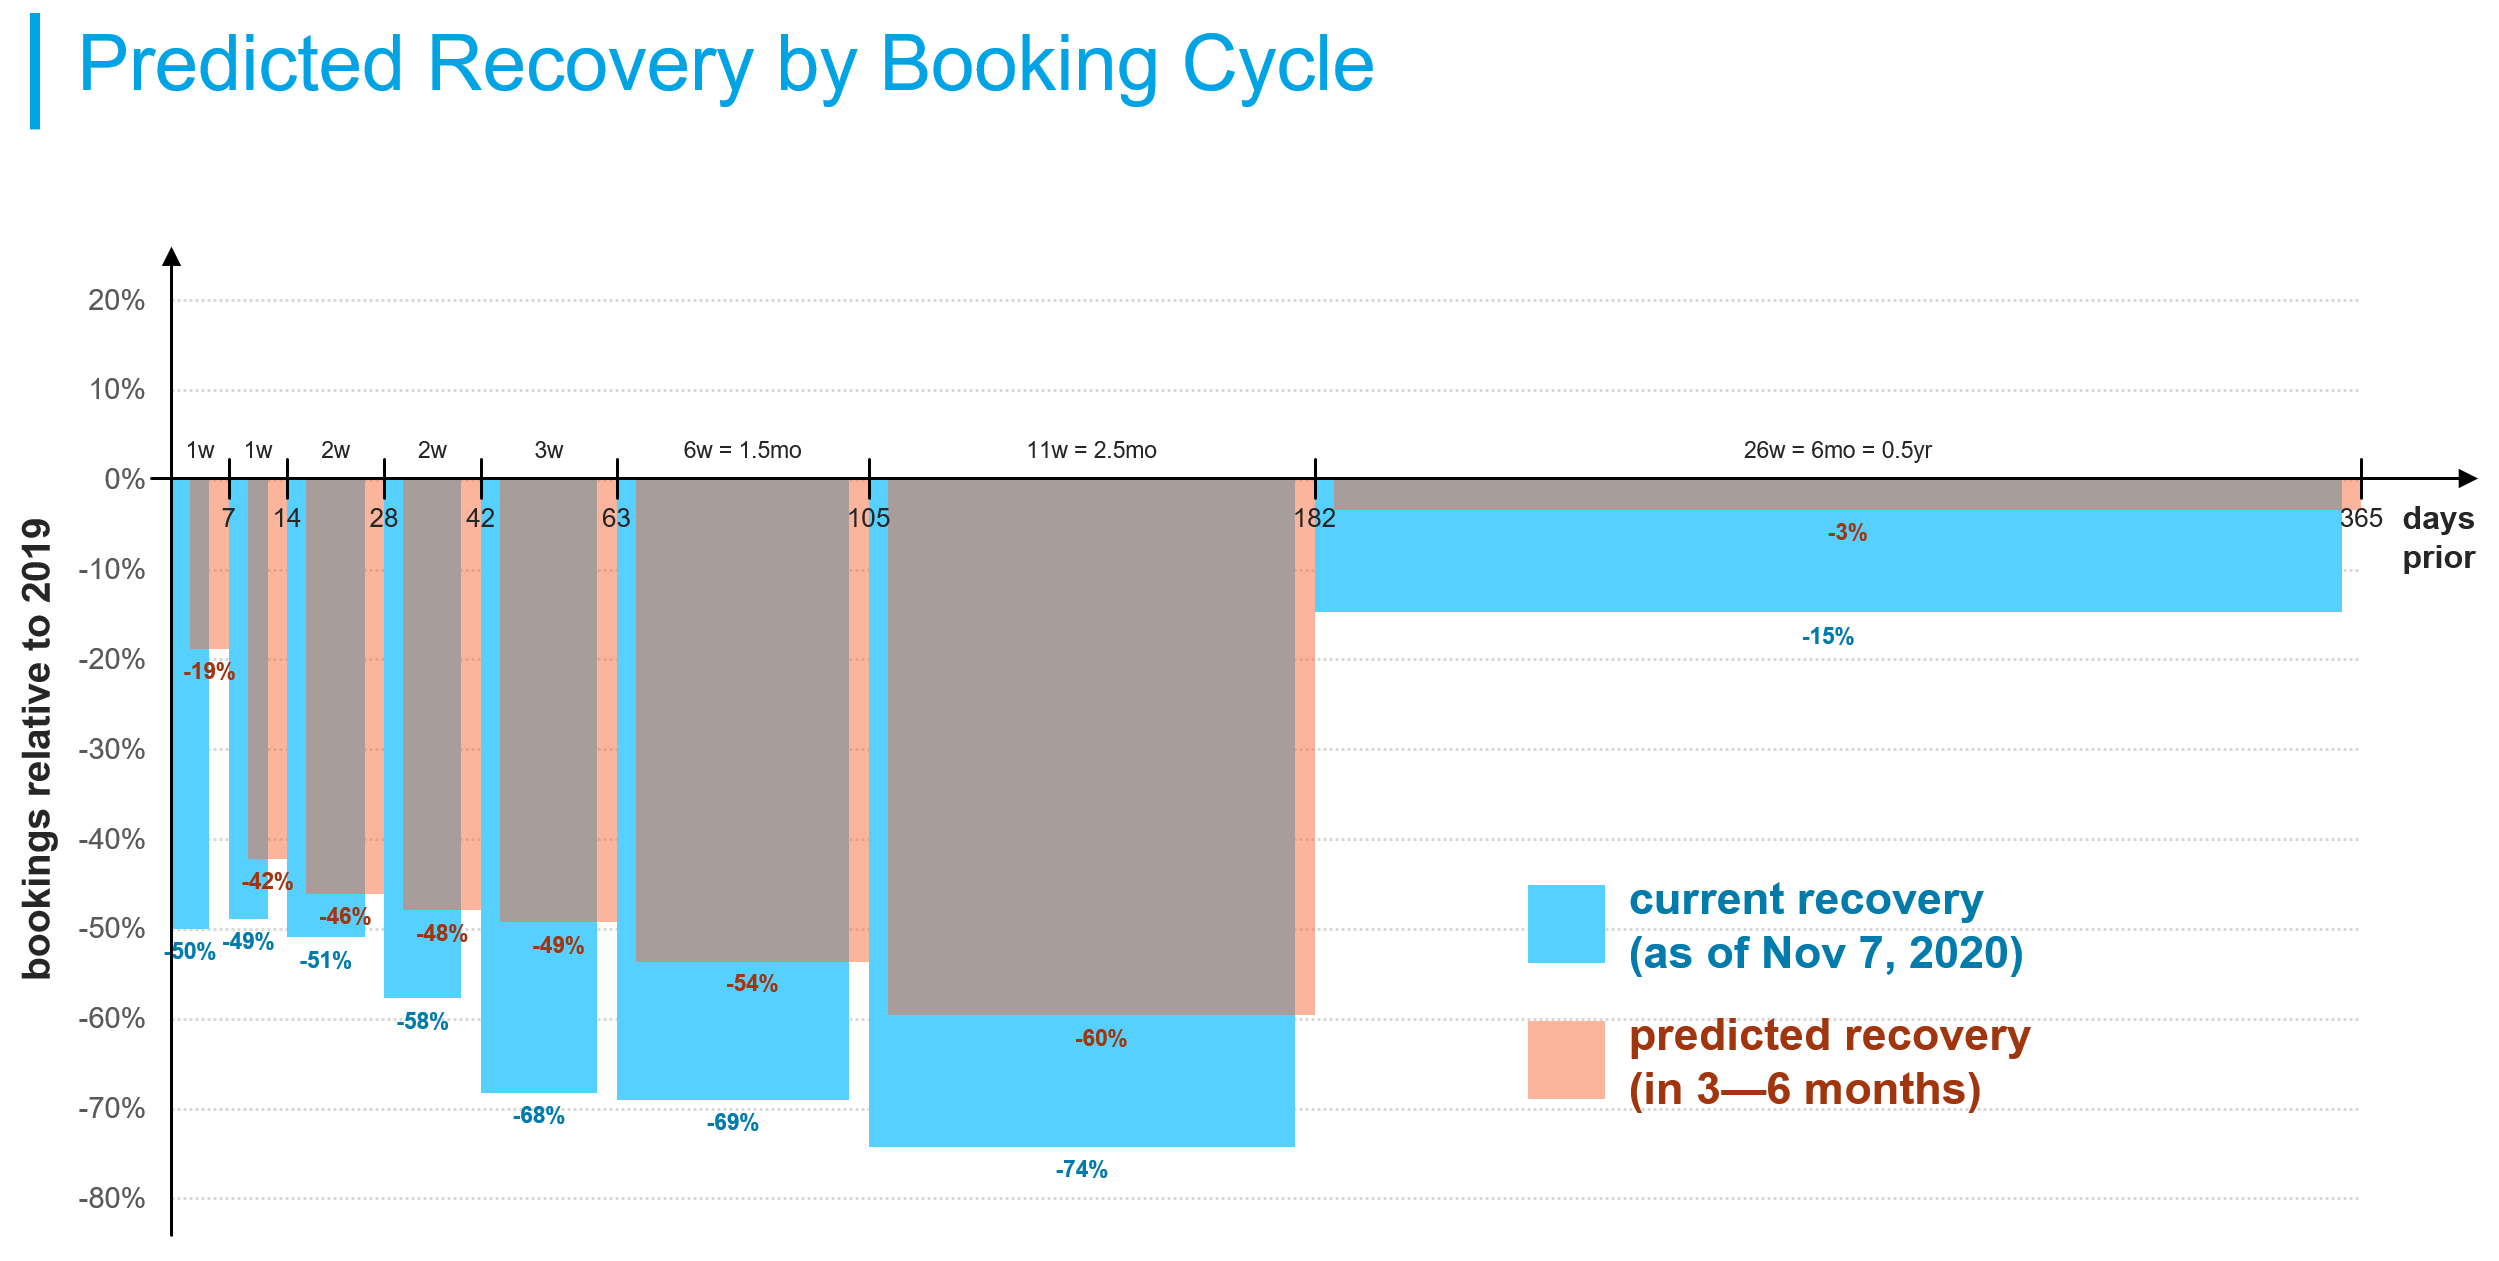
In 3—6 months, however, we can expect to see a significant (~30%) bookings recovery for travels within 1 week. This reflects the observed booking behavior of passengers in uncertain times, where people tend to book much closer to the travel date. For travels more than 1 week out (up to 6-months), we will see a 5—20% recovery from the current status.
Curiously, our model predicts that in 3—6 months, bookings for travel more than 6 months out would’ve reached a level that is only 3% below 2019 level. This means bookings for travel more than 6-months out would’ve almost recovered completely to 2019 level! Keep in mind that this booking recovery forecast is computed over 6-weeks period. The finer granularity forecasts, albeit noisy, reveal above 2019 level form some weeks.
Now, this is good news for the travel industry, because it shows that consumers definitely want to travel. But we must not get overly optimistic either, because these are bookings for travel far in the future (i.e. 6-months to 1-years from the forecasted booking date of 3—6 months in the future). That means consumers also have a lot of time to change or even cancel these bookings. So if airlines are offering no penalty for cancellation, this predicted full recovery in bookings (as real and accurate as it may be), could merely be a reflection of consumers taking advantage of these flexible cancellation policies.
Only time will tell…
Conclusion
We have built a magic crystal ball, and it is very telling. We believe that our crystal ball is singular and unique. And it’s able to make predictions that are contextual and specific based on the observed state of the world’s epidemic progression and governments’ responses. Using IHME’s future epidemic and mobility projections, we are able to make 3 sets of predictions that characterize how future booking will return in 3—6 months.
To protect the identity of our Task Force participants, we can only share these generic results at the regional level. If you like to see more specific predictions that are more granular and more specific to a particular airline, you need to sign up for our COVID-19 Task Force (CTF). Please consult your CSM about your eligibility. You might still be eligible to participate and contribute.
Arm with these predictions we are now ready to help you tune your PROS revenue management (RM) system for the expected new normal. So you definitely don’t want to miss that. Come back for our next update and we will show you what we will do with this knowledge of the future.
BTW, if you missed any of the previous updates, they are all accessible here: